 FB Group Exporter
How to get a Facebook group into Google Sheets
Google Sheets is the easiest way to explore and share a group's data with a team: filter by date, sort by engagement, chart activity or tag topics together. There is no direct connection from Facebook to Sheets, but a CSV export gets you there in a couple of minutes.
Updated October 2026
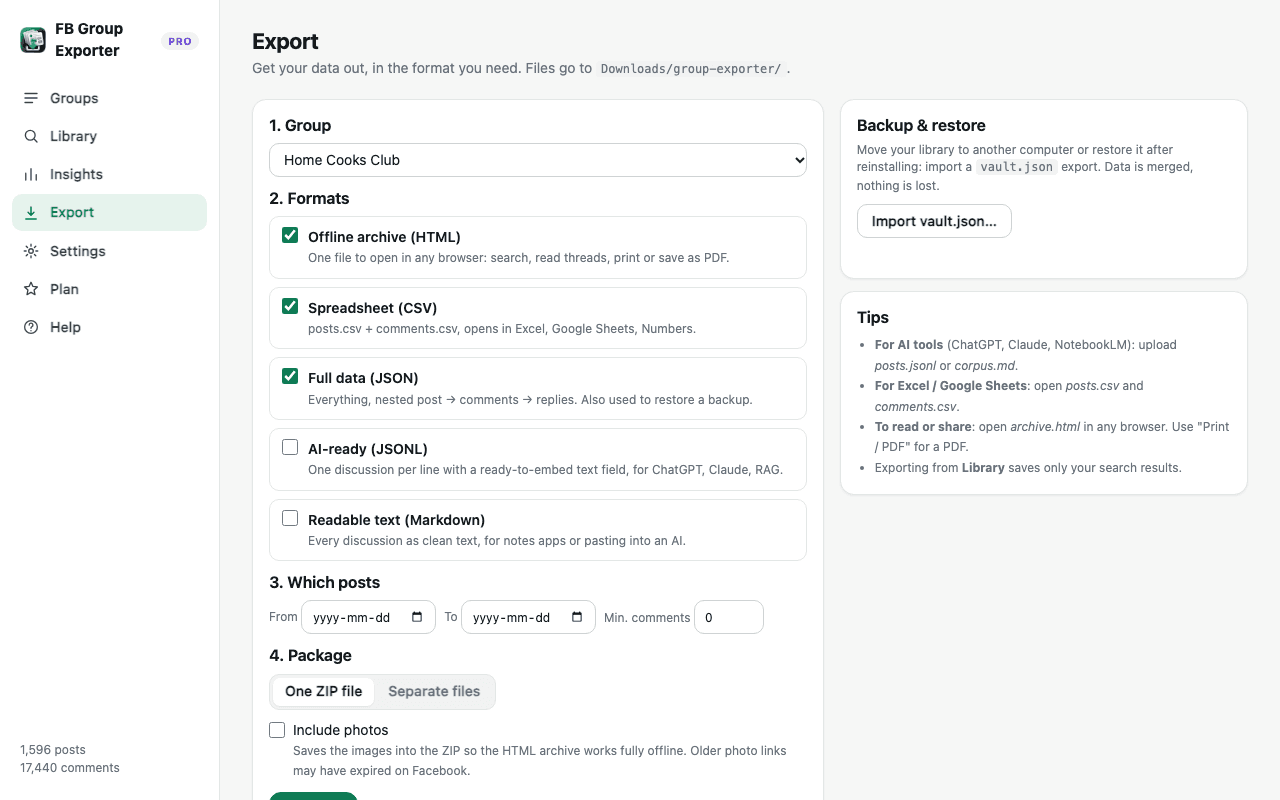
Step by step
- Download the group. With FB Group Exporter installed, open the group on Facebook and click "Download this group" in the extension popup.
- Export to CSV. In the dashboard, open Export, choose the group and tick "Spreadsheet (CSV)". You get posts.csv and comments.csv.
- Import into Google Sheets. In Google Sheets, open File → Import → Upload, pick posts.csv, and choose "Insert new sheet". Repeat for comments.csv.
- Analyse and share. Freeze the header row, add filters, build a pivot table or chart, then share the spreadsheet with your team.
Importing correctly
The CSV files are UTF-8 encoded, so emojis and accents display correctly. When importing, keep the separator on "Detect automatically" (comma) and leave "Convert text to numbers, dates and formulas" switched on so reactions and comment counts become numbers.
Long posts stay in a single cell even when they contain line breaks. Use Format → Wrapping → Clip to keep rows compact, and widen the text column when you need to read.
Cells starting with "=", "+", "-" or "@" are prefixed with an apostrophe so they can't run as formulas (a common spreadsheet-injection risk with user content).
Useful formulas and views
Most discussed posts: sort posts by the comments column, descending. Activity per month: add a column with =TEXT(B2,"yyyy-mm") and build a pivot table counting posts per month. Top contributors: a pivot table on the author column, counting rows. Topics: =REGEXMATCH(LOWER(E2),"refund|return") to flag posts about a subject, then filter.
To attach comments to their post, use =FILTER(comments!H:H, comments!B:B=A2) or XLOOKUP on post_id.
Keeping the sheet fresh
Click "Update now" in the extension to fetch new posts and comments, export again, and import with "Replace current sheet". Pro can update every day automatically and auto-export the latest CSV to your Downloads folder.
Excel, Numbers and Airtable
The same CSV files open directly in Microsoft Excel and Apple Numbers, and import into Airtable, Notion databases or Looker Studio (via Sheets).
More guides
- How to export all comments and replies from a Facebook group
- How to download the photos from a Facebook group
- How to export a private Facebook group you're a member of
- Facebook group analytics without admin access
- Collecting Facebook group data for academic research
- The best ways to export Facebook group posts and comments (compared)
- How to download all posts from a Facebook group
- How to export Facebook group posts and comments to Excel
- How to back up and archive a Facebook group
- Scrape Facebook group posts and comments without code
- How to save a Facebook group as a PDF
- Turn a Facebook group into an AI knowledge base